
In a previous entry, we examined how the redesigned ACT—with its shorter sections and higher score variance—created new opportunities for strategic testers. Because the ACT’s standard errors of measurement (SEMs) are surprisingly high (±2.71 in Reading, for example), each test sitting introduces a level of randomness that strategic students can exploit. Those who take the ACT multiple times and superscore their best section results can outperform their true average—not by getting smarter, but by playing the odds.
Test prep helps push scores higher, and that’s our focus at Ivy Tutor. But understanding the effects of statistical variance on its own helps us answer a critical question: which test gives students more benefit through repeat testing?
Does the College Board’s exam offer the same potential for strategic advantage? Or is the SAT more stable—and less exploitable—than its counterpart? To find out, we need to examine how the SAT’s design stacks up and whether it can be gamed as effectively.
Addressing What We Don’t Know About the SAT
[Note: Skip to the next section if you’re mainly interested in the results and conclusion]
Before the recent switch to the digital format, the SAT was relatively transparent, publishing reliability statistics so that colleges and other stakeholders could better interpret student scores. But with the release of the new digital SAT, the College Board—as of this writing—has not released equivalent data. Still, that doesn’t mean we can’t make informed estimates to run meaningful simulations.
On the previous version of the SAT, the College Board reported a standard error of measurement (SEM) of approximately ±32 points per section, translating to a combined SEM of about ±45 overall. (Note: SEMs are not additive, so this isn’t a simple doubling.) This is a fairly wide range. It implies that a student whose true ability aligns with a 1200 will, about 95% of the time, score somewhere between 1110 and 1290.
With the new digital SAT, which we are attempting to model, the College Board shortened the test substantially, from about three hours to just two. Normally, this kind of reduction would compromise score reliability, since fewer questions amplify the impact of lucky (or unlucky) guesses. However, the test-makers introduced several innovations designed to counteract this effect.
First, they implemented a module-adaptive design. This format eliminates the testing bloat that occurs when students are presented with questions that don’t match their ability: low-performing students are no longer wasting time with high-difficulty questions they’re unlikely to answer correctly, and high-performing students are no longer wasting time with low-difficulty questions they’re sure to answer correctly.
Second, they incorporated a scoring framework known as Item Response Theory (IRT). Unlike traditional scoring models, IRT evaluates a student’s overall performance in the context of response patterns. For instance, a student who struggles with easy questions won’t get full credit for answering a few hard ones correctly, as the model assumes those were lucky guesses. This helps reduce the noise introduced by lucky guesses.
Despite the shorter format, the structural updates give us reasonable confidence in applying the previous test’s reliability to the current one. We believe the College Board aimed to replicate the earlier SEM of approximately ±32 points per section in designing the digital SAT.
The SAT’s Superscore Gain and How it Compares to the ACT’s
With those caveats in mind, let’s look at what our simulations revealed. Estimates show meaningful gains from repeat testing. The table below shows that a student who takes the SAT twice can expect their superscore to improve by about 36 points, and their single-day composite by 26. But a motivated student who takes the test five times can see average gains of 74 points (superscore) and 53 points (composite). That’s not trivial.
Note: The SAT does not use the terms “superscore” and “composite,” but to help draw the comparison, we are applying ACT’s terminology to the SAT.
| Number of Sittings | Average SAT Superscore Gain | Average SAT Composite Gain |
|---|---|---|
| 1 | 0 | 0 |
| 2 | 36.2 | 25.5 |
| 3 | 53.9 | 37.8 |
| 4 | 66.3 | 46.7 |
| 5 | 74.3 | 52.8 |
| 6 | 81.6 | 57.7 |
| 7 | 86.4 | 61.1 |
| 8 | 91.1 | 64.3 |
This improvement curve follows the pattern we observed in Part 1 regarding the ACT. But to make an actual comparison, we need to account for the fact that the two tests use different scoring scales. Fortunately, there’s a straightforward way to standardize the results: convert them into Z-scores, which normalize the data by centering the average at zero and setting the standard deviation to one.
Once we do that, the difference becomes clear: superscoring benefits ACT testers more than SAT testers. It’s worth noting again that the SAT projections are based on estimated reliability figures, so those results should be viewed as approximations.
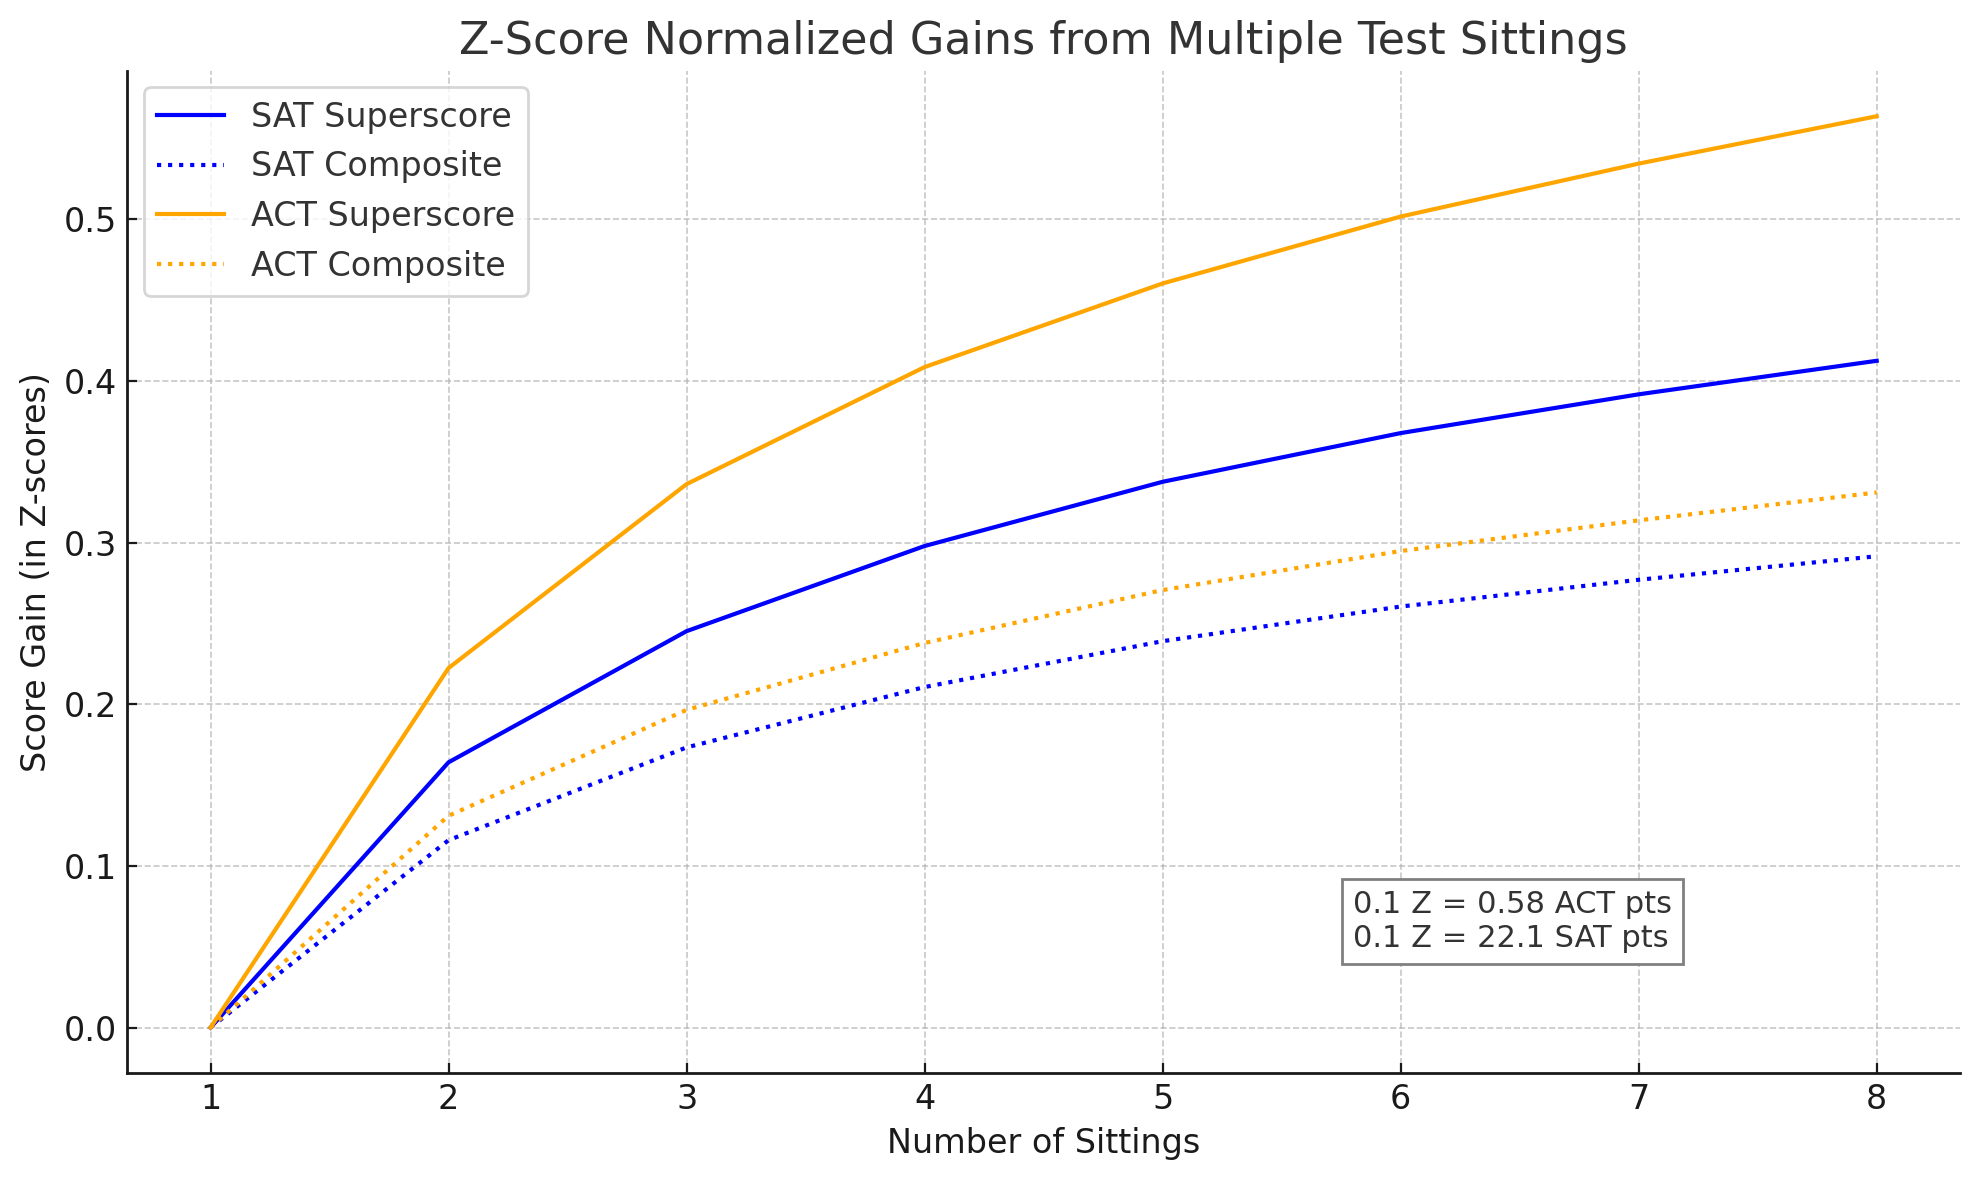
What this further reveals is that the ACT superscore strategy offers an increasing edge over the SAT when compared to the simulation conducting in Part 1. The difference in standardized (z-score) terms for a hypothetical student who takes both tests 5 times grows to about 0.12, which is equivalent to roughly 0.7 ACT points or 27 SAT points.
Now for those wondering how to interpret a 0.7-point gain on the ACT—given that the ACT only reports scores in whole-number increments—here is what it means: For about 7 out of 10 students who take both tests 5 times, their ACT superscore will land 1 full point higher than the ACT-equivalent of their SAT superscore. The odds are favorable, but also consider that for those 7 students, that single-point increase translates to an advantage of approximately 38 SAT points, the rough equivalent of an ACT point, rather than the expected average increase of 27 points.
Thus, taken as a whole, students will tend to score 1 ACT point or the equivalent of ~30 SAT points higher through repeated testing 5 times and superscoring on the ACT than they would through an equivalent strategy on the SAT. That might not sound dramatic, but it’s meaningful. At the margins, that difference matters. It could mean one or two extra college acceptances or thousands of dollars per year in merit aid. For students willing to sit for the test multiple times, the ACT is the smarter bet.
From the perspective of a motivated student, this is good news. And ACT Inc. is likely counting on sharp analysts to notice the asymmetry and point it out, knowing that students will respond by purchasing more test sittings. We discussed the broken incentive structure in Part 2 of this series.
A Final Word
This analysis is part of our broader mission: putting students in the strongest possible position to succeed. Our primary focus is on building real skills: improving students’ thinking, performance, and confidence. That’s where the most meaningful gains happen.
But success on standardized tests isn’t just about ability. It’s also about understanding how the system works and using that knowledge to a student’s advantage. That’s why we dig into the data at this level of depth. We believe students deserve every possible edge, and it’s our job to make sure they get it.